
DataMagic
About this tool
Developed by the DIAL team at HKUST (Guangzhou), DataMagic turns spreadsheet data into narrated visual stories. It includes reusable animation recipes, sample data and rendering code for research presentations and sharing findings. Use the companion skill to choose a recipe, connect your data and render a video, then edit the generated code to adjust the visuals and timing.
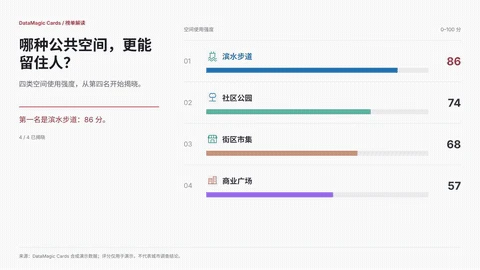
- Data to video: Bind CSV or other tabular data to animation recipes and render chart videos.
- Story formats: Choose ranking reveals, trends and other formats, with narration to explain findings.
- Editable code: Keep the generated code and adjust the visuals and pacing for your research.
Resource information
- Maintainer
- Data Intelligence and Analytics Lab (DIAL), HKUST (Guangzhou); university laboratory, GitHub organization HKUSTDial.
- Type
- Skill
- Category
- Scientific figures & presentations
- Runs on
- Agent Skills
- Who it's for
- Researchers and research administrators making research presentations, academic talks or public-facing videos from data.
- License at time of listing
- MIT
- Source
- GitHub